Connect every system. Trust every number.
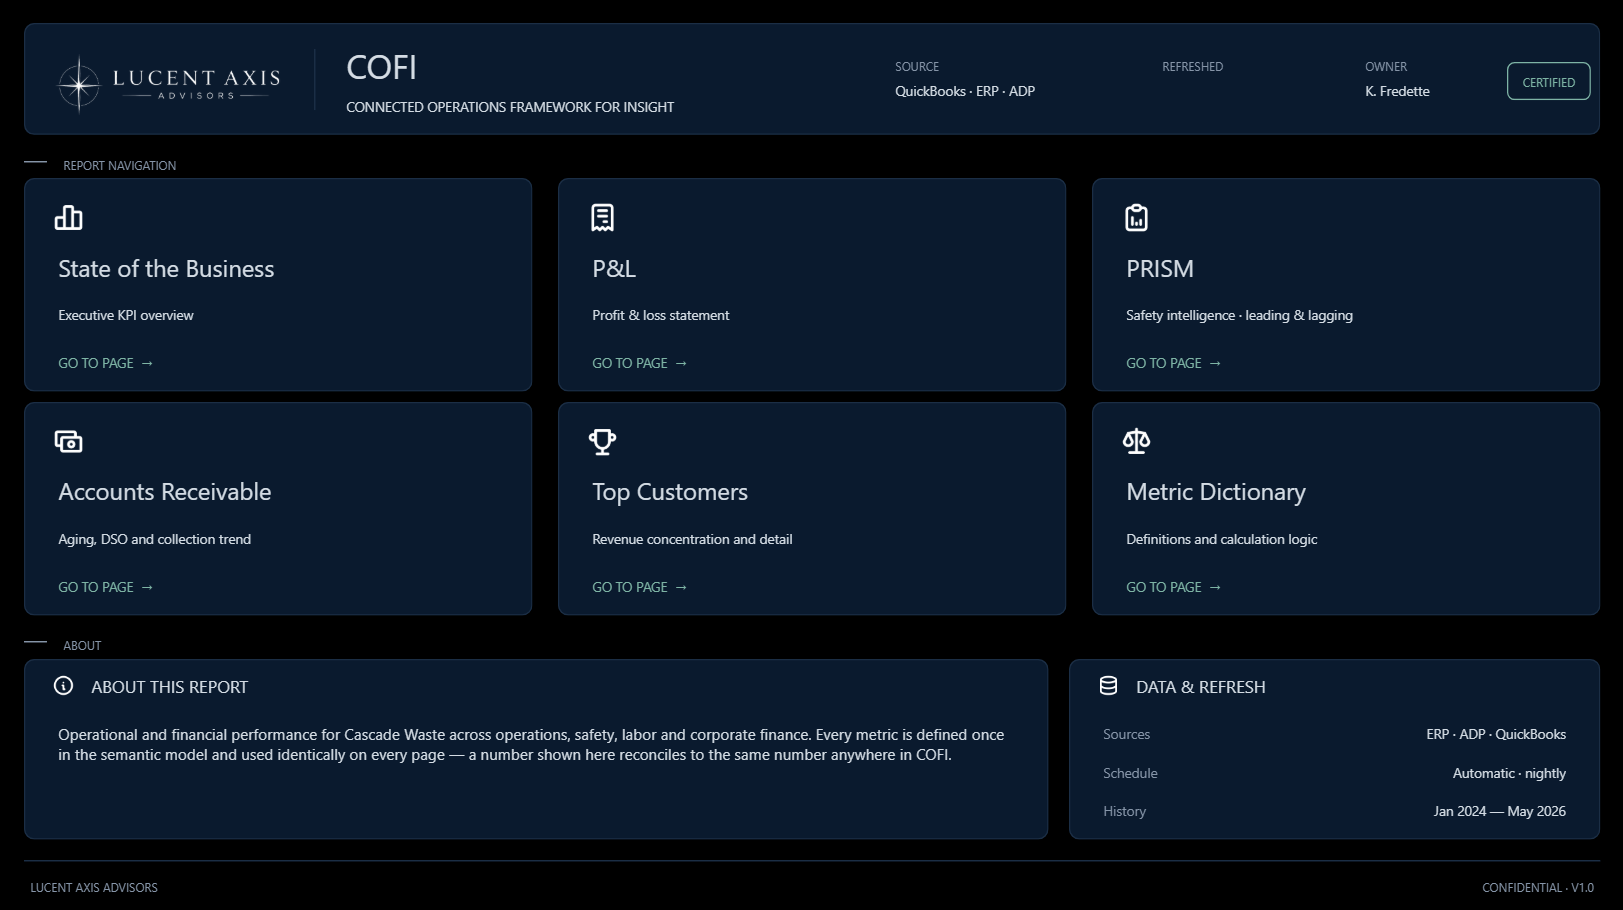
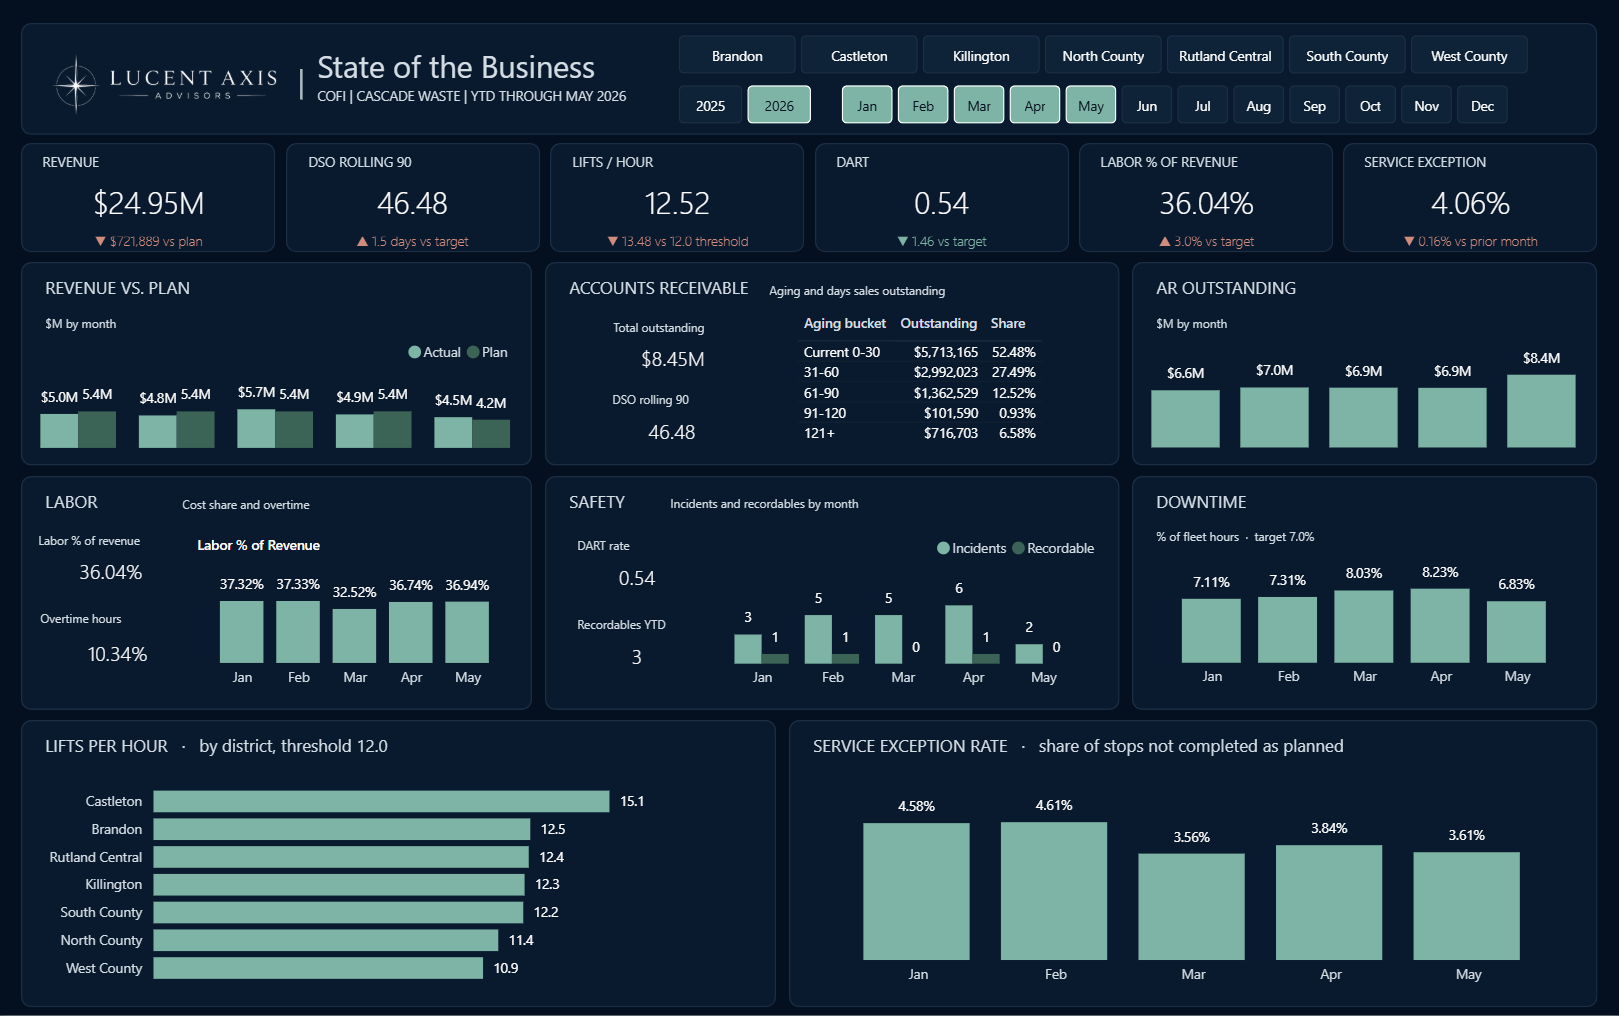
BI dashboards, KPI frameworks, and predictive modeling built on COFI: Lucent Axis's reporting suite that connects ERP, labor, safety, and financial systems into one single pane of glass.
One connected view, built to be trusted.
Most operators aren't short on data. They're short on a version of it everyone agrees on.
One single pane of glass
ERP, labor, safety, and financial systems connect into one governed reporting layer, so every team works from the same numbers.
What your systems have been hiding
Integration surfaces data quality issues, anomalies, and missing or incorrect data before they ever reach a dashboard.
Decisions you can act on
Clean, connected data becomes the foundation for identifying operational gaps and making faster, better decisions.
Reporting, integration, and the work behind both.
Operations Analytics isn't a dashboard project. It's the full path from disconnected systems to governed, decision-ready reporting.
Reporting
BI dashboards, KPI frameworks, and predictive modeling, built on COFI.
Integration
Disparate source systems, including ERP, labor, safety, and financial platforms, connected into a single pane of glass.
Data Quality
Every integration surfaces anomalies, gaps, and missing or incorrect data as it happens, not after.
Implementation
Full analysis, discovery, and implementation that moves your team off manual Excel and onto automated, KPI-driven processes.
From manual Excel to governed reporting.
Discovery & analysis
We assess what's currently manual, what's disconnected across systems, and where the numbers can't be trusted.
Integration & implementation
Your source systems connect into COFI's semantic model, with data quality issues surfaced as we go.
Automated, KPI-driven reporting
Manual Excel gives way to governed dashboards your team can trust and act on daily.
Data integrity is the differentiator.
Connecting your systems into COFI does more than centralize reporting. It's the mechanism that makes everything after it possible.
Data integrity
Bringing every source system into one place exposes exactly where the data itself breaks down.
Gap identification
Those data issues point straight at the operational gaps behind them: process breakdowns, missing controls, disconnected teams.
Better decisions
Once the data is trustworthy and the gaps are visible, decisions get faster and more confident, at every level of the business.
"The data work isn't the deliverable. Trustworthy data is what finally lets an operator see, and fix, the gaps that were always there."
Frequently asked.
What does Operations Analytics include?+
Reporting built on COFI (BI dashboards, KPI frameworks, and predictive modeling), integration of disparate source systems such as ERP, labor, safety, and financial platforms into a single pane of glass, and the discovery and implementation work that moves a team off manual Excel and onto automated, KPI-driven processes.
How is this different from just building dashboards?+
Dashboards are the visible layer. The real work is connecting the source systems underneath them, and that integration is what surfaces the data quality issues, anomalies, and missing or incorrect data those systems have been carrying. A dashboard built on ungoverned data just makes a bad number easier to read.
What happens during discovery?+
We assess what's currently manual, what's disconnected across systems, and where the numbers can't be trusted. That assessment sets the integration and implementation plan that follows.
Ready to see your systems in one place?
Book a 30-minute call to walk through where your reporting stands today and what COFI can show you.
Book a 30-minute call